The Link Between Blood Sugar, Insulin, and How Long You Live
Jun 17, 2026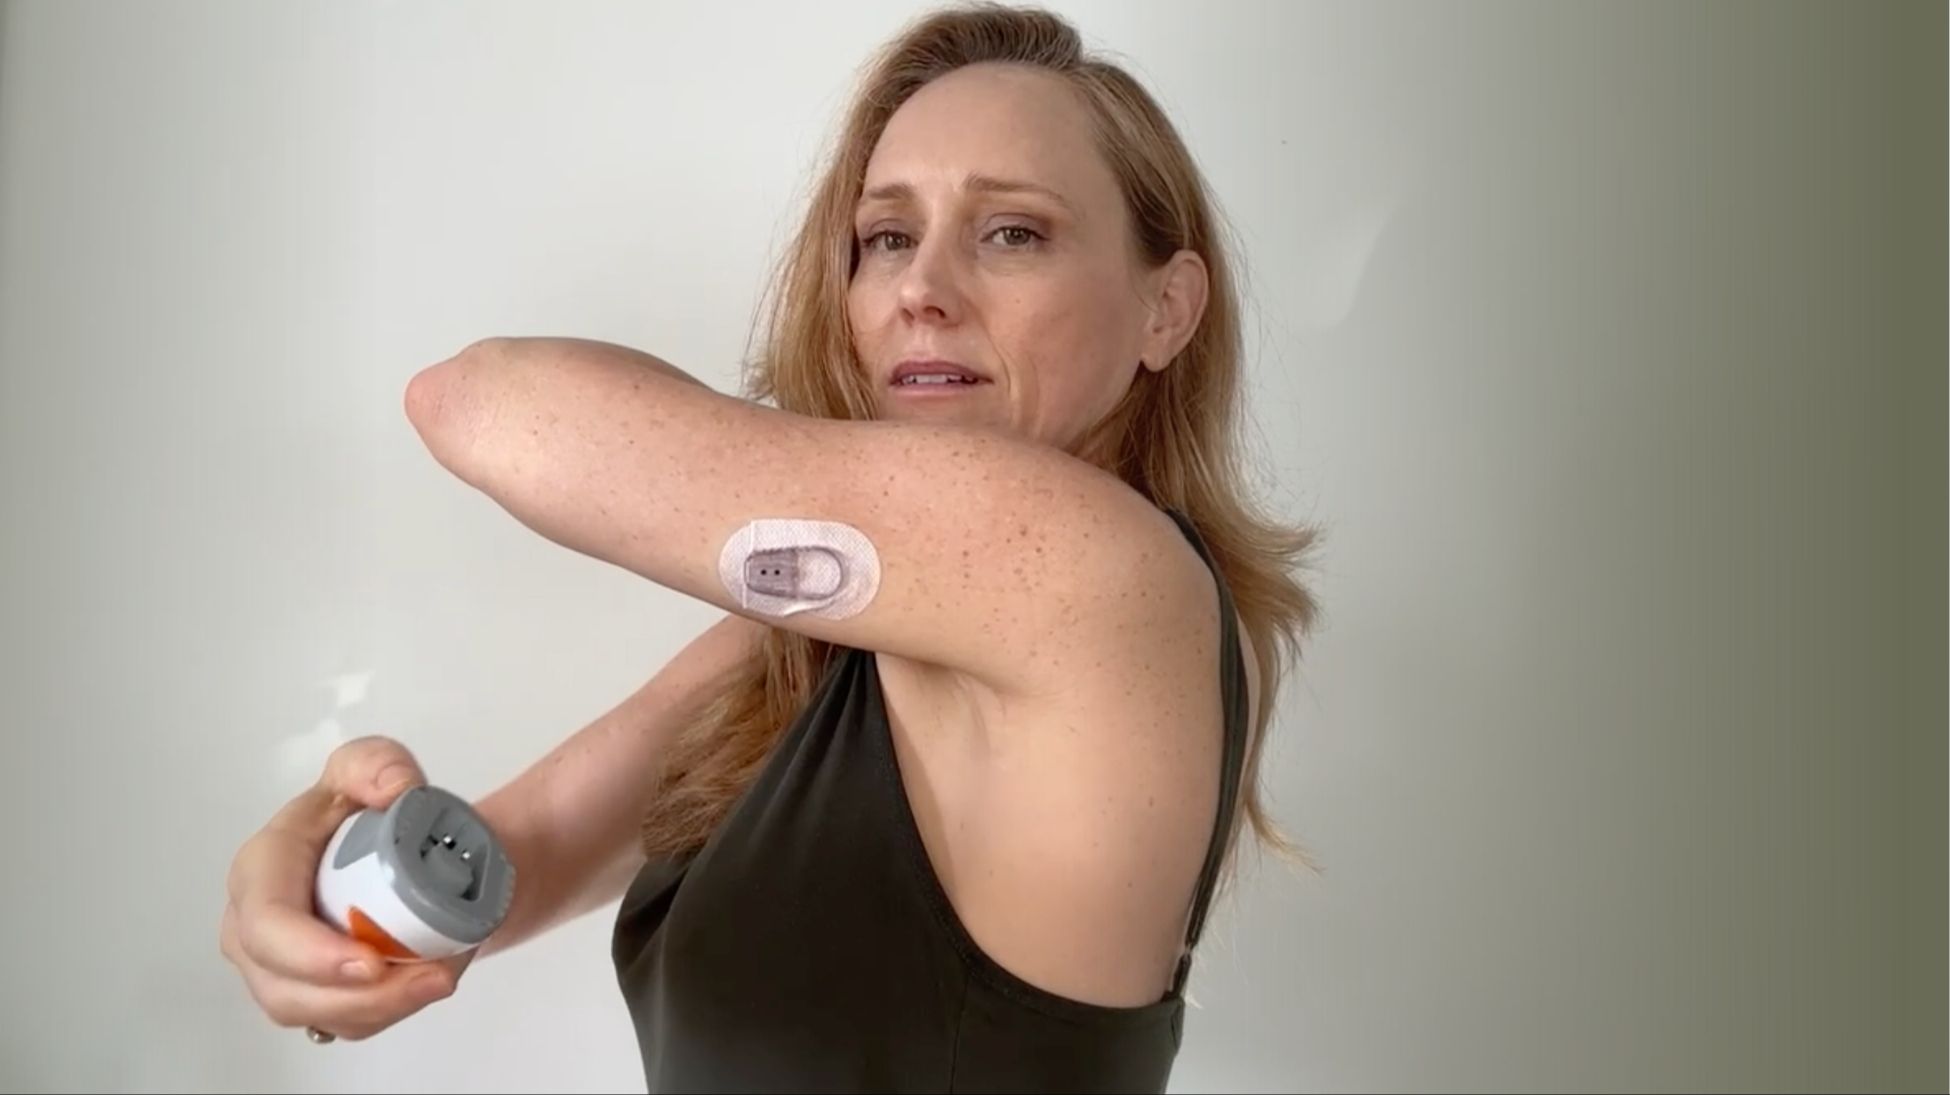
Part of the Longevity Metrics Series: Auditing My Health as I Turn 55
Most people don’t think much about blood sugar unless diabetes enters the conversation. If their annual bloodwork comes back “normal,” they understandably assume there’s nothing more to know.
But blood sugar isn’t only about diabetes. It’s part of how your body creates and manages energy, and it can be influenced by everything from food and movement to sleep, stress, hormones, and muscle mass.
The difficulty is that the numbers most commonly tested don’t all tell us the same thing. An A1C, a fasting-glucose result, a fasting-insulin result, and data from a continuous glucose monitor each offer a different piece of the picture.
Before we look at my results, let’s make sense of what these terms mean and why they may matter to your health over time.
Blood sugar, also called blood glucose, isn’t inherently bad. Glucose is an important source of energy. When you eat, especially foods containing carbohydrates, some of that food is broken down into glucose and released into your bloodstream.
Insulin is a hormone produced by your pancreas. One of its jobs is to help move glucose out of your blood and into your cells, where it can be used for energy or stored for later.
When this system is working well, your body doesn’t need an excessive amount of insulin to keep glucose within a healthy range. When your cells become less responsive to insulin, your pancreas may compensate by producing more of it. This is called insulin resistance.
That compensation can continue quietly for years. You may feel fine. Your routine bloodwork may look normal. But your body may be working harder to maintain those apparently normal numbers.
That’s why I wanted to look at both blood glucose and insulin as part of my longevity audit.
Why blood sugar matters even if you don’t have diabetes
Many people think of blood sugar as a binary issue: you either have diabetes or you don’t.
The body is more nuanced than that.
Insulin resistance and prediabetes can develop gradually and often without obvious symptoms. They also don’t exist in isolation. As insulin resistance develops, changes may appear elsewhere, including in triglycerides and other parts of the lipid panel.
Blood sugar regulation is also connected to inflammation. Chronic low-grade inflammation can interfere with the way cells respond to insulin, while metabolic dysfunction can activate additional inflammatory pathways. As I explored in my post on inflammation and longevity, these systems can begin reinforcing one another.
Over time, impaired glucose regulation is associated with increased risk for type 2 diabetes, cardiovascular disease, and other metabolic problems. But this isn’t simply a story about risk.
Blood sugar is influenced by many things we can work with, including movement, muscle mass, food, sleep, stress, hormones, medications, and daily patterns. The goal isn’t to become frightened of food or obsessed with achieving a perfectly flat glucose line. It’s to understand how these parts of your health connect so you can make better-informed decisions.
What is A1C?
If you have routine bloodwork, you may already have had an A1C test without knowing exactly what it measures.
A1C, also called hemoglobin A1C, estimates your average blood glucose over roughly the previous two to three months. According to the National Institute of Diabetes and Digestive and Kidney Diseases, an A1C below 5.7% is generally considered within the normal range. Results between 5.7% and 6.4% fall within the prediabetes range, while a result of 6.5% or higher may indicate diabetes when appropriately confirmed.
A1C is useful, but it isn’t a complete picture.
Because it reflects an average, it can’t show you what happens throughout an ordinary day. It doesn’t tell you how your glucose responds to a particular breakfast, a poor night’s sleep, an intense workout, dehydration, or an emotionally stressful conversation.
A1C results can also be influenced by certain medical conditions and differences in red-blood-cell turnover. Like every test, it answers a particular question. It doesn’t answer every question.
That doesn’t make A1C unhelpful. It means we should understand what the number can and can’t tell us.
The relationship between glucose and insulin
Imagine that glucose is waiting outside your cells and insulin is helping open the door.
When your cells respond well to insulin, the system can work efficiently. When they become less responsive, your pancreas may send out more insulin to accomplish the same task.
For a time, that extra effort may keep fasting glucose and A1C within normal ranges. This is one reason some practitioners look at fasting insulin alongside glucose measurements and the rest of a person’s health history.
Fasting insulin isn’t currently a standard diagnostic test for prediabetes. But it provides another useful piece of information, particularly when it’s interpreted with fasting glucose, A1C, triglycerides, waist circumference, family history, medications, symptoms, and other relevant factors.
The important shift is from asking, “Is this one number normal?” to asking, “What do these signals suggest when we look at them together?”
What about HOMA-IR?
You may encounter a calculation called HOMA-IR, or Homeostatic Model Assessment of Insulin Resistance. It uses fasting glucose and fasting insulin from the same blood draw to estimate insulin resistance.
It can be useful in research and sometimes as part of a broader clinical assessment, but it’s still an estimate. Thresholds vary across studies and populations, and it shouldn’t be treated as a standalone diagnosis.
My March panel included fasting insulin, but the glucose measurement from that draw wasn’t fasting. Because HOMA-IR requires fasting glucose and fasting insulin from the same blood draw, I can’t calculate a valid HOMA-IR from these results.
My fasting-insulin results can still be considered alongside my A1C, CGM data, triglycerides, body composition, and other health markers to create a more complete picture.
What a continuous glucose monitor can add
A continuous glucose monitor, or CGM, is a small wearable sensor that measures glucose in the fluid just beneath the skin throughout the day and night.
Instead of giving you a single snapshot, it reveals patterns.
That’s what interested me.
A CGM allowed me to see how my body responded not only to food, but also to sleep, movement, hydration, stress, meal timing, and the order in which I ate different foods.
I learned that a walk before or after a meal could change my response. Pairing carbohydrates with protein and fiber often helped minimize glucose spikes. Sleeping fewer than seven hours made glucose regulation more difficult the following day.
I also received glucose alerts during situations I didn’t consciously experience as stressful, including shopping in Sephora and listening to a friend describe a painful experience. My body was registering something that my conscious mind hadn’t yet named.
That’s where tracking becomes especially interesting to me. It can make a previously invisible connection visible.
You can read more about what I learned in Why I Track My Blood Sugar Even Without Diabetes.
Muscle, menopause, and metabolic health
Blood sugar doesn’t exist in isolation from the rest of the body.
Skeletal muscle is one of the major places glucose is taken up and used. Maintaining muscle gives the body more metabolically active tissue and is one reason resistance training becomes increasingly important as we age.
This connection became especially relevant to me during menopause.
The hormonal changes of menopause can affect body composition, fat distribution, and insulin sensitivity. But the relationship is complex. Age, sleep, stress, activity, genetics, medications, muscle mass, and other factors all contribute.
Hormone therapy may influence glucose metabolism in some women, but it isn’t a guaranteed way to improve insulin sensitivity. It’s one part of a highly individualized medical decision.
For me, the useful question isn’t whether estrogen alone determines my glucose response. It’s whether my metabolic patterns change as my hormones, muscle mass, sleep, stress, and daily habits change.
That’s something I can continue to observe over time.
This connection between glucose and muscle is also why body composition was the metric immediately preceding blood sugar in my longevity audit. They aren’t separate conversations.
What my numbers show
Here are the results I reviewed as part of my March 2026 audit:
- A1C: 5.4%. This falls within the current normal range.
- Non-fasting glucose: 109 mg/dL. Because the sample wasn’t fasting, it shouldn’t be compared with fasting-glucose thresholds.
- Free, bioactive fasting insulin: 2.6 μIU/mL.
- Total fasting insulin: 2.9 μIU/mL.
- Average glucose during my January CGM period: 104 mg/dL.
Taken together, these results are reassuring and consistent with good insulin sensitivity. They don’t prove that every glucose response is ideal, nor do they predict my metabolic future with certainty.
They tell me that the practices I’ve built appear to be serving me well right now.
That’s the point of collecting data. It isn’t to receive a permanent grade. It’s to understand where you are, decide whether anything deserves attention, and create a baseline that helps you recognize meaningful change.
What I’m continuing to do
My approach isn’t extreme or complicated.
I continue to:
- Build and preserve skeletal muscle.
- Walk when I can after meals.
- Pair carbohydrates with protein, fiber, and fat.
- Pay attention to meal composition and eating order without turning food into a rigid set of rules.
- Protect my sleep.
- Stay hydrated.
- Work with stress and nervous-system regulation.
- Use a CGM periodically.
- Review glucose, insulin, lipids, hormones, data from a CGM, body composition, sleep, fitness, and lived experience as parts of one interconnected picture.
Questions worth asking
You don’t need to order every available test or wear a monitor indefinitely.
You might begin by asking:
- Have I had an A1C, fasting insulin, and fasting glucose recently?
- What do those results mean in the context of my age, history, medications, symptoms, and risk factors?
- Have my results changed over time, even if they remain within the reference range?
- Could sleep, stress, menopause, muscle loss, activity, or meal patterns be influencing what I see?
- Would a short period of glucose monitoring answer a question that routine bloodwork can’t?
These are questions I explore with my clients. Then we work with an appropriate healthcare professional, especially if you have symptoms, abnormal results, diabetes, prediabetes, take glucose-lowering medication, or have a history of disordered eating.
The larger lesson
Your body isn’t a collection of unrelated numbers.
A1C tells us something. Fasting glucose tells us something. Insulin, triglycerides, muscle mass, hormones, sleep, stress, movement, and real-life patterns may each add another part of the picture.
No single number gets to tell the entire story.
The purpose of gathering health data isn’t to create another standard you can fail. It’s to reveal connections, ask better questions, and make choices with greater clarity.
If you’ve received a diagnosis of prediabetes or diabetes, or you simply want to understand and manage your blood sugar more effectively, this is absolutely work I can help you with.
I can help you examine the patterns affecting your glucose, make sense of your available health data, and turn recommendations into practices that work in your actual life.
Start with a comprehensive Initial Consultation. We’ll look at what you’re experiencing, what you already know, what you’ve tried, and what information may help us understand the larger picture.
For some people, one consultation is enough to find clarity and a path forward.
Frequently Asked Questions
Fasting glucose tells you how much glucose is circulating in your blood after an overnight fast. Fasting insulin tells you how much insulin your pancreas is producing to manage that glucose. Your fasting glucose may remain within the normal range while your body produces increasing amounts of insulin to keep it there. Looking at both numbers can reveal more about how efficiently your body is managing glucose than either number can provide alone. HOMA-IR, or Homeostatic Model Assessment of Insulin Resistance, is an estimate calculated from fasting glucose and fasting insulin taken during the same blood draw. It can help show how much insulin your body needs to maintain its fasting glucose level. A result below about 1 is often associated with strong insulin sensitivity, while results above roughly 2.5 to 3 may raise concern about insulin resistance. Cutoffs vary among studies and populations, so HOMA-IR is most useful when it’s interpreted with your other health data rather than treated as a diagnosis by itself. Yes. A1C estimates your average glucose over the previous two to three months. It can’t show how your glucose changes throughout the day, how high it rises after particular meals, or how much insulin your body may be producing to maintain that average. A normal A1C is useful and reassuring, but it doesn’t rule out insulin resistance or glucose patterns worth understanding. Fasting glucose, fasting insulin, triglycerides, symptoms, health history, and, when useful, CGM data can add important context. You don’t need a CGM to manage your health, but wearing one for even a few weeks can reveal patterns that routine bloodwork can’t. It can show how your glucose responds to specific foods, sleep, stress, hydration, exercise, meal timing, and other parts of daily life. You also don’t need to wear one forever. I use a CGM periodically to learn what’s working, identify anything that has changed, and make more informed decisions based on how my own body responds. The hormonal changes of menopause can affect insulin sensitivity, muscle mass, fat distribution, sleep, and stress regulation. Each of these can influence how the body manages glucose. This doesn’t mean every woman will develop insulin resistance during menopause. It means glucose results should be interpreted in the context of hormonal changes, body composition, symptoms, medications, sleep, movement, and the rest of her health picture. Skeletal muscle is one of the body’s primary destinations for glucose. When muscles contract, they can take up and use glucose for energy. Maintaining more metabolically active muscle also gives the body greater capacity to manage glucose over time. That’s why resistance training matters for far more than strength or appearance. Building and preserving muscle is one of the most powerful long-term tools we have for supporting insulin sensitivity, metabolic health, physical resilience, and healthy aging. Responses vary from person to person, which is one reason CGM data can be so revealing. Refined carbohydrates and liquid sugars consumed on their own, including white bread, white rice, many cereals, sweets, juice, and sugary drinks, commonly produce faster and larger glucose rises. Context matters. Pairing carbohydrates with protein, fiber, and fat can slow their absorption. Eating protein and vegetables before the carbohydrate portion of a meal may also reduce the glucose rise, and walking after a meal can help muscles use circulating glucose. Building and maintaining muscle is one of the most powerful long-term ways to support healthy blood sugar because muscle uses glucose for energy. Regular movement, especially walking after meals, can also influence your glucose response right away. Food composition, sleep, hydration, stress regulation, hormones, medications, and individual health history matter too. The most effective approach is to understand which factors are having the greatest effect in your body and begin there.What’s the difference between fasting glucose and fasting insulin?
What is HOMA-IR, and what can it tell you?
Can I have a normal A1C and still have blood sugar problems?
Do I need a CGM if I don’t have diabetes?
How does menopause affect blood sugar?
How does muscle mass affect blood sugar?
What foods cause the biggest blood sugar spikes?
How can I support healthy blood sugar?
Further Reading
Why I track my blood sugar without a diabetes diagnosis
Lipid Panels, Longevity, and the Number Your Doctor Probably Isn’t Testing
How Sleep Quality Predicts Longevity - My Personal Data
Inflammation: The Longevity Metric Hiding Inside All the Others
Beyond the Biomarkers: A Different Kind of Longevity Audit
Author