The Link Between Blood Sugar, Insulin, and How Long You Live
Jun 17, 2026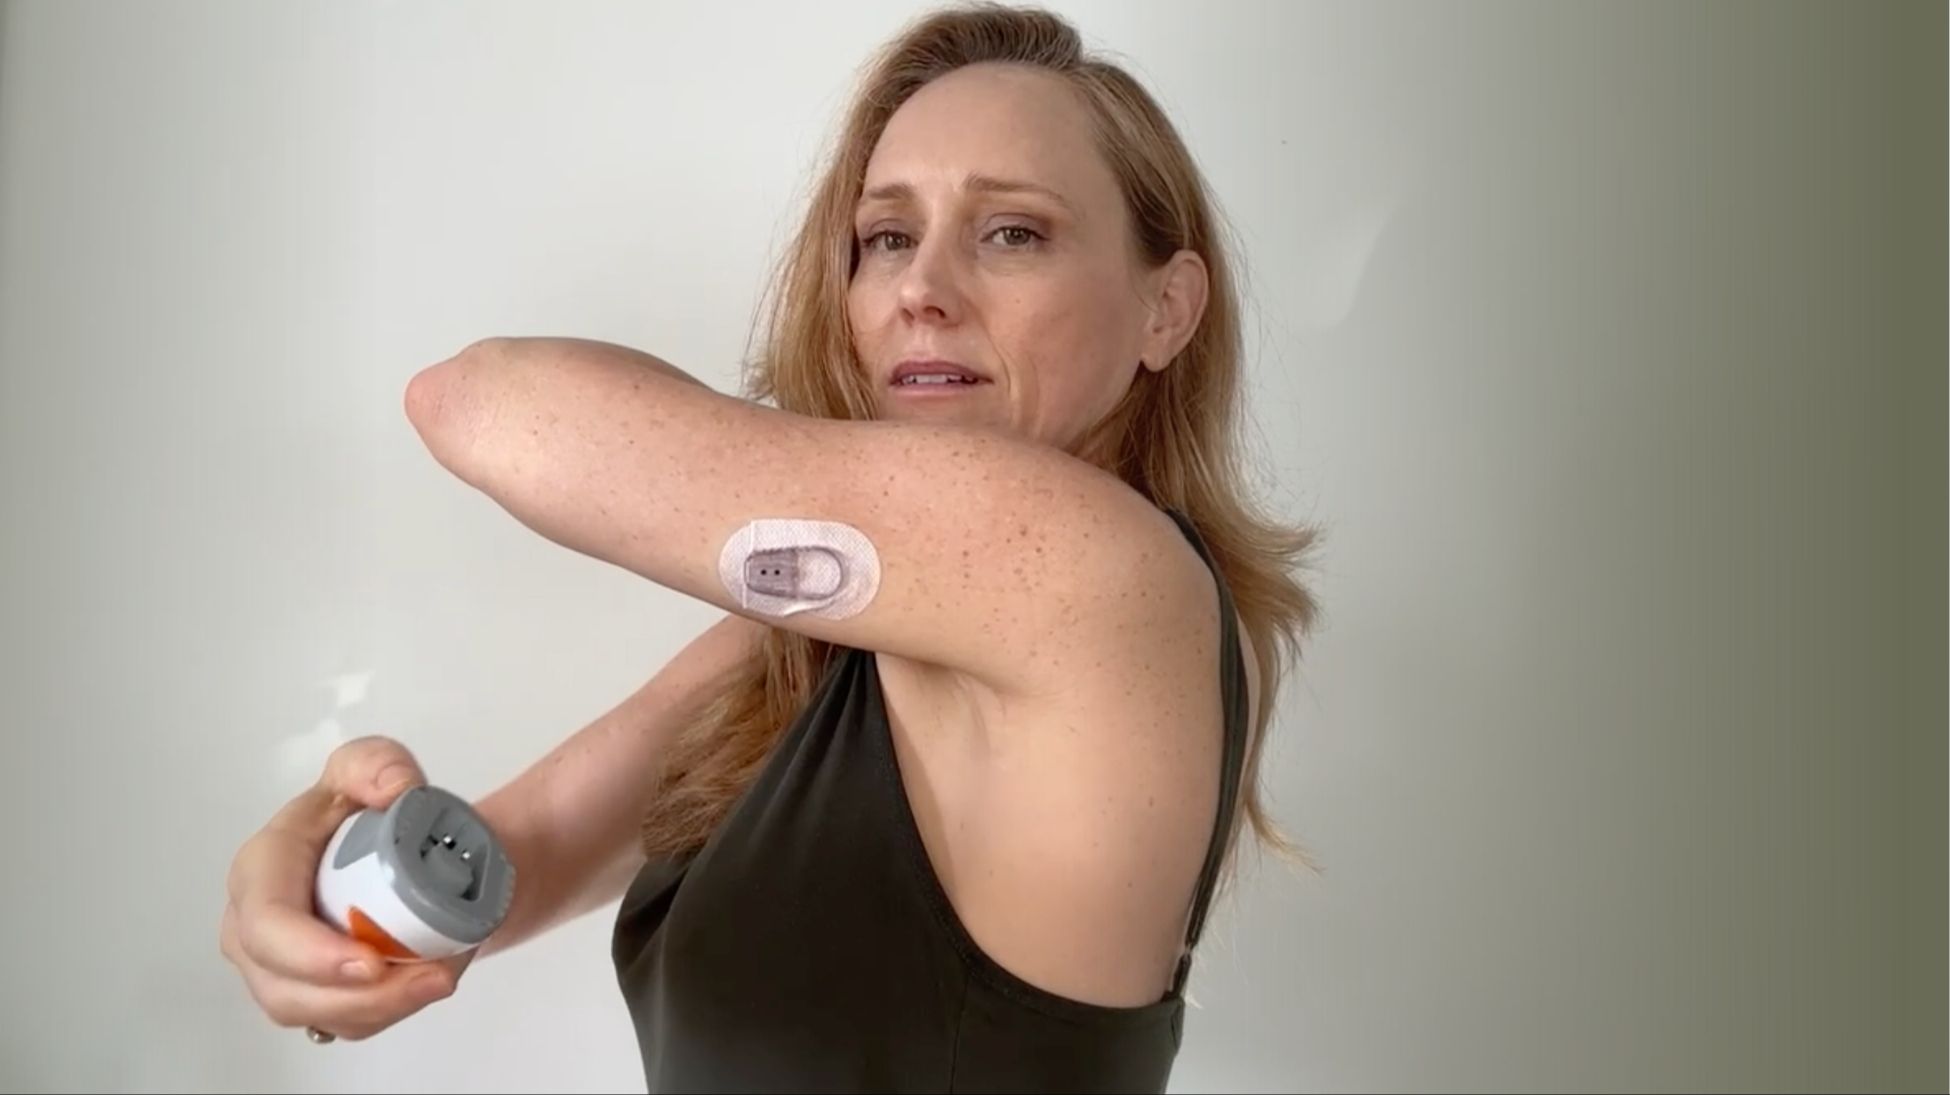
Part of the Longevity Metrics Series: Auditing My Health as I Turn 55
Most people think about blood sugar only when diabetes comes up. Either they have it, or they don't, and if they don't, the topic disappears until the next annual blood draw.
But blood glucose dysregulation accumulates quietly, for years, through patterns that a once-yearly A1C test won't necessarily catch.
Metric 8 of my birthday longevity audit is blood glucose and insulin.
And the most important number in this section is one that most doctors don't test at all.
Why A1C Is Not Enough
A1C (hemoglobin A1c) measures the percentage of hemoglobin proteins in your blood that have been glycated (coated in sugar) over the past two to three months. It gives you a rough average. Below 5.7% is considered normal. Between 5.7% and 6.4% is prediabetes. Above 6.5% is a diabetes diagnosis.
Averages are useful. They're also misleading.
You can have an A1C of 5.5%, and that would be considered perfectly "normal", even though you may have spent multiple hours every day above 140 mg/dL. The spikes and the crashes average out. The A1C looks fine. But in fact, the metabolic stress on your blood vessels, nerves, and brain is not fine.
This is why I've been wearing a continuous glucose monitor (CGM) periodically for years, and why I think it's one of the most useful tools available to anyone who wants to understand their metabolic health before a problem develops. I've written a companion post to this one that covers why I track my blood sugar without a diabetes diagnosis , what I learned from wearing a CGM for three months the first time, and the specific practices I now maintain as a result. That post covers the how and the what I learned. This one is about the why, the longevity research behind glucose tracking, and where my numbers actually stand.
The Number Most Doctors Don't Test: Fasting Insulin
Here's the gap in standard blood glucose testing: it measures glucose, the symptom, but not insulin, the underlying mechanism.
Insulin is the hormone your pancreas produces to move glucose out of your bloodstream and into your cells. When insulin sensitivity is high, a small amount of insulin does the job efficiently. When insulin resistance develops (the early-stage precursor to type 2 diabetes that can persist silently for a decade before blood sugar is visibly elevated), the pancreas has to produce more and more insulin to achieve the same result.
Fasting glucose can stay completely normal during this compensatory phase. A1C can look normal. Meanwhile, the pancreas is working overtime, insulin levels are rising, and none of the standard tests catch it. Fasting insulin is what catches it.
The difference between a fasting insulin of 3 and a fasting insulin of 15 matters long before blood sugar is elevated visibly in basic labs. HOMA-IR is the index clinicians use to quantify this. It's calculated from fasting glucose and fasting insulin together, giving you a picture of how efficiently your body is managing the relationship between the two. Below 1.0 is often cited as optimal. Above 2.9 begins to indicate meaningful insulin resistance, though some studies use 2.5 as the threshold. Most standard panels don't include it, because most standard panels don't include fasting insulin. Which is the whole problem.
Because the research on what chronically elevated insulin predicts for longevity isn’t subtle.
What Glucose Variability Actually Predicts
The second gap in standard testing is the focus on averages rather than variability.
A CGM tracks glucose every few minutes around the clock. It gives you something no lab test can: a picture of how your body actually responds to food, stress, sleep, and exercise in real time.
The mechanism isn't mysterious. Repeated spikes drive oxidative stress and inflammation. They trigger glycation, the process by which excess glucose binds to proteins and slowly damages blood vessels, nerves, and other tissues. A high average glucose is a problem. But high variability, even when the average looks fine, compounds the damage. It's the difference between a river that runs steady and one that floods and recedes repeatedly. The flood damage accumulates even when the average water level reads normal.
Time in the 70 to 140 mg/dL range is the benchmark most clinicians use to assess CGM data in healthy adults. That's the standard I track myself against.
Menopause, Muscle, and Glucose: How They Connect
Metabolic health in postmenopausal women is not the same as in premenopausal women, and treating it as such is an error.
Estrogen is directly involved in insulin sensitivity. It activates pathways that enhance glucose uptake by muscle and fat tissue, and it supports the liver's ability to respond appropriately to insulin. Research published in the American Journal of Pathology confirmed that declining estrogen levels independently increase insulin resistance risk in menopausal women, separate from the effects of age or weight change.
When estrogen declines, muscles become less responsive to insulin's signal. Less glucose gets absorbed. Blood glucose runs higher. The pancreas produces more insulin to compensate. This is the beginning of the insulin resistance spiral, and it's driven by hormonal changes, not just diet or lifestyle.
This is why the glucose, muscle, and hormone metrics in this series are not separate topics. They're the same conversation from different angles. As I covered in Metric 6 on body composition , skeletal muscle accounts for more than 80% of insulin-stimulated glucose uptake. Less muscle means less metabolic real estate for glucose to go. And estrogen itself plays a direct role: research shows HRT significantly improves insulin sensitivity in postmenopausal women without diabetes, which is one of the reasons I'll be covering hormones later in this series.
My Numbers
March 2026 lab panel:
Non-fasting glucose: 109 mg/dL. In the context of a non-fasting draw, this is completely normal. The threshold for concern on a non-fasting glucose is considerably higher than fasting norms. Nothing to flag here.
A1C: 5.4%. In the normal range. Pre-diabetes starts at 5.7%. My estimated average glucose from this A1C is approximately 108 mg/dL, which is consistent with what my CGM data showed.
Fasting insulin (free, bioactive): 2.6 μIU/mL. This is the number I'm most pleased with. Free bioactive insulin is the biologically active fraction: what the body actually has access to. At 2.6, this indicates excellent insulin sensitivity. My body is responding to glucose efficiently and not having to produce excess insulin to manage it.
Fasting insulin (total): 2.9 μIU/mL. Also very low.
HOMA-IR: I don't have a same-draw fasting glucose to pair with this insulin level for a precise calculation. Using an estimated fasting glucose of approximately 85 mg/dL - which is typical for someone with my A1C and CGM average - and a fasting insulin of 2.9, my HOMA-IR is approximately 0.6. The clinical threshold is generally set somewhere between 2.5 and 2.9. I'm nowhere near it.
January 2026 CGM:
Average glucose those weeks: 104 mg/dL. Well within normal range and consistent with my lab work.
Time above range: the worst day was 1 hour 40 minutes above range. Most days were under 40 minutes, with several days at zero minutes above range. Against the community benchmark of less than 15 minutes per day above 140 mg/dL, my worst day is elevated and my average is not. There are specific foods and situations that drive those spikes. I know what they are from three months of data years ago, so now I can make informed choices before eating, and I manage around them. I’m not surprised when a meal at the pub with a pint gives me a spike - I’m choosing to enjoy it anyway, because those are the exception, not the norm.
The honest read: my glucose metabolism is in strong range for my age and menopausal status, with excellent fasting insulin indicating good underlying insulin sensitivity. The variability picture is good with occasional outliers I understand and can account for.
What I'm Doing
The practices I've maintained since my first three months of CGM data are in the companion post : walking after meals, pairing carbohydrates with protein and fiber, food ordering, sleep as a metabolic lever, stress management, and hydration. These aren't theories. I've watched my CGM data respond to each of them in real time.
Two things I've added since:
The first is muscle. Building and maintaining skeletal muscle is the most durable structural improvement I can make to my glucose metabolism. This was a major motivation behind taking resistance training more seriously, because more muscle means more insulin-sensitive tissue, which means lower circulating glucose and lower insulin demand across the board.
The second is HRT (Hormone Replacement Therapy). Estrogen's role in insulin sensitivity is not incidental. One of the things I'll be tracking closely as I continue my HRT protocol is whether my glucose data improves as estrogen and testosterone levels rise. I expect it will, based on the research.
I'll know more after I get CGM data early next year - I wear a CGM for two to four weeks each year as a check-in. The goal isn't constant surveillance. It's periodic recalibration, checking that the practices I've built are still working, identifying anything that has shifted, and adjusting accordingly. For example, two years ago, I noticed glucose control had softened despite maintaining my habits. I made targeted changes (a bilberry supplement and a metabolic probiotic), and the following year's CGM confirmed improvement. That's the tracking philosophy in practice.
The Summary
- Blood glucose dysregulation is one of the most modifiable longevity risks available, meaning that the interventions, primarily muscle, sleep, stress regulation, diet quality, and where relevant, hormone support, work. The challenge is catching the problem before it becomes a problem, because the standard panel won't do that on its own.
- Fasting insulin is the test worth asking your doctor for.
- Glucose variability, tracked periodically with a CGM, is the picture worth seeing at least once.
- An A1C is a useful floor, not a ceiling.
My numbers are strong. The practices that produced them are maintainable and non-extreme. And the monitoring system I have in place means I'll catch it early if anything shifts.
If understanding your own metabolic picture and building the practices to protect it sounds like work you want to do with a guide, explore ways to work with me . If you’ve recently been diagnosed with pre-diabetes or diabetes and want a more rigorous coaching experience, my concierge program is built for exactly that.
Frequently Asked Questions
What is the difference between fasting glucose and fasting insulin?
Fasting glucose tells you how much sugar is in your blood after an overnight fast. Fasting insulin tells you how much insulin your pancreas is producing to manage that glucose. You can have normal fasting glucose and elevated fasting insulin — meaning your pancreas is working harder than it should be to keep blood sugar in range. That's early insulin resistance, and standard panels miss it because they don't test insulin.
What is HOMA-IR and what's a good number?
HOMA-IR (Homeostatic Model Assessment of Insulin Resistance) is calculated by multiplying your fasting glucose by your fasting insulin and dividing by 405. It's the most commonly used clinical estimate of insulin resistance. Below 1.0 is considered excellent. Below 2.0 is generally normal. Above 2.9 begins to indicate meaningful insulin resistance. You need both fasting glucose and fasting insulin from the same blood draw to calculate it — which is why it's worth asking for both at your next panel.
Can I have "normal" A1C and still have blood sugar problems?
Yes. A1C reflects a two-to-three-month average. If you're spiking to 160 mg/dL after meals and dropping back down, the average can look completely normal while your vascular and metabolic system is absorbing repeated stress. A CGM reveals the variability that the average hides. It's not about fear — it's about having the right tool for the question you're actually asking.
What is a continuous glucose monitor and do I need one?
A CGM is a small sensor worn on the arm that tracks your blood sugar continuously, every few minutes, without finger pricks. It connects to an app on your phone. You don't need to be diabetic to benefit from wearing one, and you don't need to wear one forever. Even two to four weeks of data can be transformative for understanding how your specific body responds to food, sleep, stress, and exercise. I've written a full post on how and why I use one .
How does menopause affect blood sugar?
Estrogen directly supports insulin sensitivity — it activates pathways that help muscle and fat tissue absorb glucose from the bloodstream. When estrogen declines at menopause, insulin sensitivity decreases independently of age or weight. Postmenopausal women are at significantly higher risk of developing insulin resistance than premenopausal women of the same age. This is one of the reasons HRT is relevant to metabolic health, not just symptom management.
How does muscle mass affect blood sugar?
Skeletal muscle accounts for more than 80% of insulin-stimulated glucose uptake. More muscle means more metabolic real estate for glucose absorption, which means lower blood sugar and lower insulin demand after meals. This is one of the most direct mechanistic links between resistance training and metabolic health — not a general "exercise is good" claim, but a specific physiological pathway. It's also why sarcopenia (low muscle mass) and insulin resistance tend to travel together.
What foods cause the biggest glucose spikes?
Individual responses vary more than most people realize — this is one of the most powerful things CGM data reveals. That said, refined carbohydrates eaten alone (white bread, white rice, pasta, most breakfast cereals, juice) produce the largest and fastest spikes for most people. The mitigation strategies that work most reliably: pair carbohydrates with protein and fiber, eat in that order (protein and vegetables before carbohydrates), and walk within 10 to 15 minutes after eating. I've covered all of these in more detail in the CGM companion post .
Further Reading
Why I track my blood sugar without a diabetes diagnosis — ctwain.com
Glucose variability and longevity in Chinese centenarians — PMC
Time in glucose range and survival in non-diabetic critically ill adults — PMC
The role of estrogen in insulin resistance — American Journal of Pathology
HRT and cardiovascular health including insulin sensitivity — PMC (2026)
Author


